In my time as a research software engineer (RSE) at the National Renewable Energy Laboratory, I've noticed a pattern in funding and staffing cycles where both can be discontinuous or change unexpectedly, resulting in lost momentum and institutional knowledge on software projects. While this pattern is likely inherent to research itself, RSEs can mitigate these impacts and improve the overall quality of their software by communicating elements of software design within the development workflow. As a 2023 Better Scientific Software Fellow, I've collected resources and developed training material to empower people (especially RSEs) to visually communicate ideas and themes within their software projects, and the results are described here.
Documenting ideas, decisions, and institutional knowledge is a powerful way to mitigate the effects of discontinuous momentum during software development efforts. Early in the development cycle, requirements are identified; some of them are adopted while others may be rejected, intentionally. As the form and function of the code start to take shape, capturing these decisions will give future developers meaningful context. To that end, I suggest development teams adopt visual communication methods to describe ideas and their implementations using Unified Modeling Language (UML) diagrams via automated tooling. Narrative content around these diagrams is helpful and encouraged, but the diagrams often speak for themselves. Once the initial diagrams are in place, future developers can build on them to scope and plan work, while inherently communicating the impact to the entire system. This article briefly describes UML and its role in the development workflow for research software engineers.
One product of my BSSw Fellowship is an online dashboard with more information on UML and resources for tooling and automated processes as needed for research software. That site will be updated periodically with suggested workflows and examples of good software diagrams. And the site is open for contribution, so please send along outstanding diagrams that you've created or found.
UML, class diagrams, and sequence diagrams
The Unified Modeling Language (UML) was created in 1995 and adopted in 1997 by the Object Management Group, a standards consortium. In essence, UML is a set of graphical notations described by metamodels that enable describing and designing software systems. UML is particularly relevant to software developed in the object-oriented paradigm, but the methods and notations are broadly relevant to software engineering and systems engineering (see SysML). The notations defined in UML can be considered syntax for creating a specific set of diagrams useful in software design and analysis. While UML defines 14 types of diagrams, the following eight are particularly useful, and the first two are described further:
- Class diagram
- Sequence diagram
- Package diagram
- Deployment diagram
- Use case diagram
- State diagram
- Activity diagram
- Interaction overview diagram
Class diagrams are directly correlated to object-oriented programming, and the class diagram metamodel is shown in Figure 1. Attributes and methods on a class can be described with their visibility, argument types, and return type. Abstract classes and abstract methods are denoted in italics. Inheritance, aggregation, composition, and association are described with lines connecting classes and specific types of line endings for each type of relationship.
 Figure 1: The UML class diagram metamodel.
Sequence diagrams are broadly applicable to systems when describing algorithms, processes, and procedures, and the sequence diagram metamodel is shown in Figure 2. The metamodel relates participants by passing messages (commands) and data between them. A rectangle on a participant's line indicates whether a portion is "on" or "off", and boxes encompassing events denote if-statements, loops, and parallel processes.
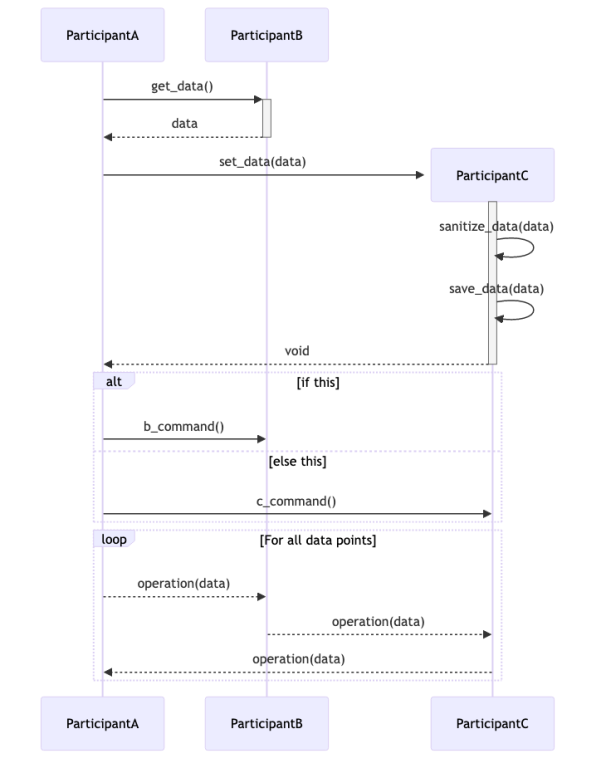 Figure 2: The UML sequence diagram metamodel.
Perspective
The UML metamodels provide the visual syntax to describe a software system with varying levels of fidelity. While it can be tempting to include as much detail as possible, too much information can mask the intended message. I suggest instead to focus on the audience and specific message to communicate by considering the following questions:
- Who is the intended audience, and what is their level of experience with your software?
- In a few sentences, what specifically are you communicating?
- At what level does the content of the message exist in the software: conceptual, specification, or implementation?
The three diagrams in Figure 3 are taken from one of my software projects, FLORIS, a wind farm wake modeling framework that provides specific interfaces where developers can plug in new wake models. Consider the three perspectives:
- Conceptual describes the relationships between the main components of the software and notes in red where to connect a new wake model.
- Specification describes the connections between a portion of the wake model and the software objects that interface with it.
- Implementation describes the specific attributes on a particular class and its inherited properties.
While each is valuable, maintaining separation allows for focusing a diagram on specific themes for a given audience.
 Figure 3: A comparison of conceptual, specific, and implementation perspectives in diagrams from the FLORIS framework.
Documentation-driven development
Analogous to test-driven development, documentation-driven development is the practice of stating what the code should do prior to writing it, and diagramming at this stage can make the design process more effective. The result of documentation-driven development may be a design document that can take the form of an internal document, a page in online documentation, or a GitHub Discussion or Issue. Suggested content to include in a design document are:
- Scope and suggested design of the work
- Relationship of new code to existing elements of the software, including current implementations and overarching themes
- New themes and design decisions included and excluded
While a strict policy of "docs or it didn't happen" can increase the quality and quantity of documentation, it comes with the added burden for developers, reviewers, and maintainers. A more approachable process is to require an extended pull request description that includes a narrative of the changes and an overview of design decisions. In any case, including automated diagramming tools in the software infrastructure can reduce the burden and empower developers to adopt this practice.
Summary
Through the BSSw Fellowship, I've had the opportunity to gather and formalize ideas on documentation and communication on software design. I presented at the NLIT S3C conference in April 2024 (slides) and will present an HPC Best Practices webinar in June 2024. I've also put together an online dashboard to share notes, ideas, and examples of good software diagrams and resources for including this in the software development workflow.
Stepping back to consider the big picture, I see visual communication as a critical component for the future of scientific software. The scientific software community has common design patterns and syntactic conventions, but I feel that we often lack the words and methods to communicate about software systems themselves. I hope to build on this work in search of a pattern language that will unlock a shared understanding of the systems we create so that we can use it both to create new, more impactful software and bring meaningful recognition to the research software engineers who create them.
Please get in touch at rafael.mudafort@nrel.gov, GitHub, or LinkedIn.
Resources mentioned
- Online dashboard: Communicating Design
- Slides: 2024 NLIT S3C
Acknowledgement
This work was supported by the Better Scientific Software Fellowship Program, funded by the Exascale Computing Project (17-SC-20-SC), a collaborative effort of the U.S. Department of Energy (DOE) Office of Science and the National Nuclear Security Administration; and by the National Science Foundation (NSF) under Grant No. 2154495.
Author bio
Rafael Mudafort is a senior researcher at the National Renewable Energy Lab’s National Wind Technology Center, focusing on computational modeling of wind turbine and wind farm dynamics and controls. He has served as the research software engineer for several wind energy software packages, and he is currently involved in an effort to coordinate and elevate the quality of NREL’s wind energy software. Rafael is also a 2023 Better Scientific Software Fellow.

